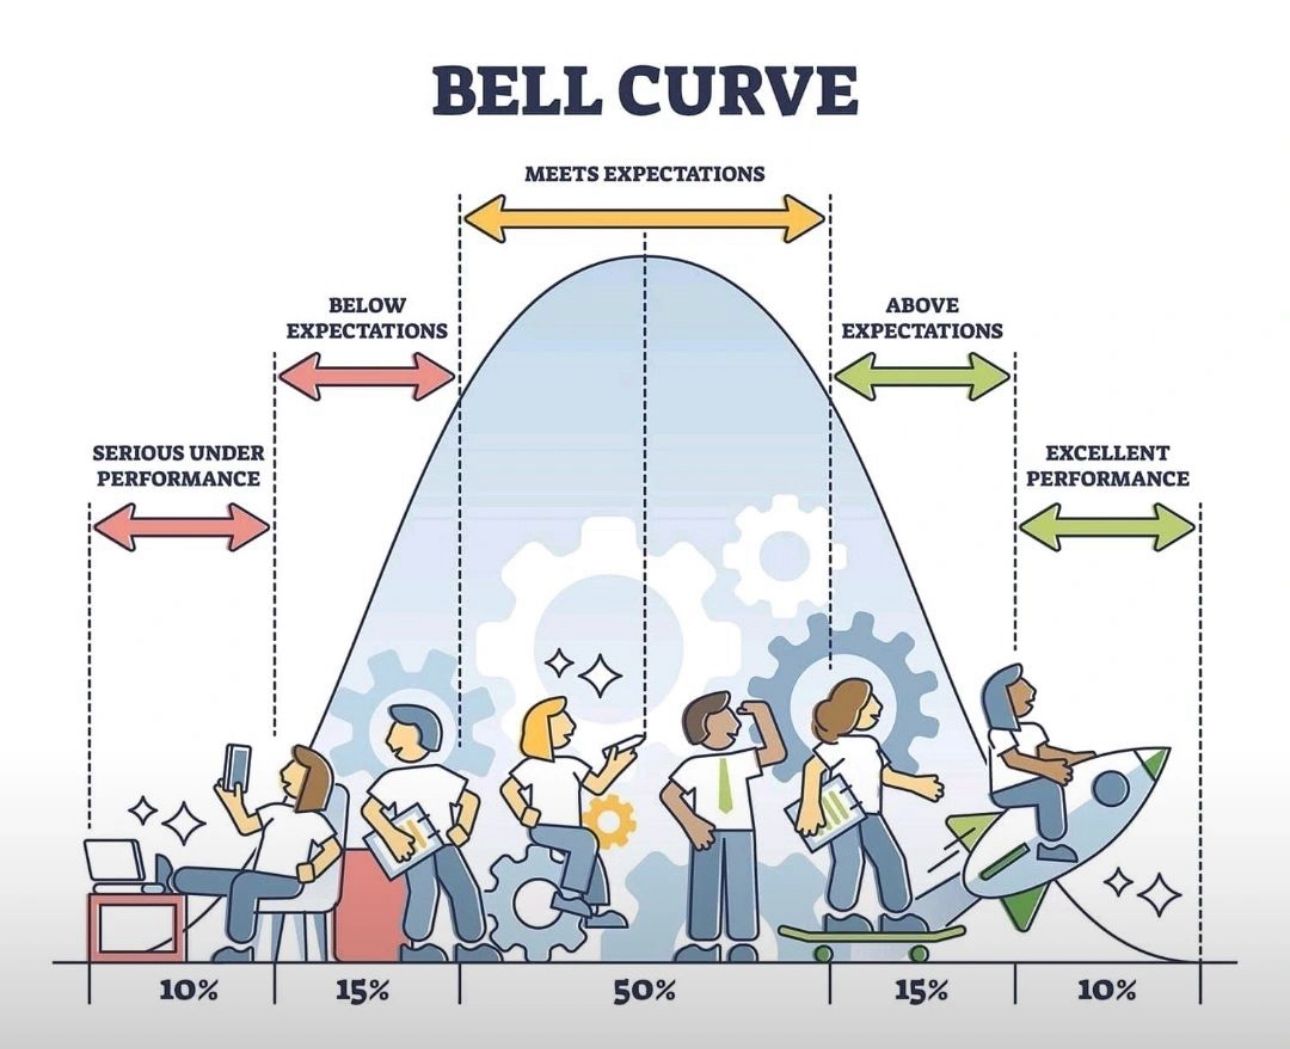
📊 Performance Bell Curve for Team Leaders – Where Do You Stand?
Understanding the Performance Bell Curve in Teams
As a team leader, you’ve likely seen how performance is distributed across your team. The performance bell curve is a powerful way to visualize this.
Typically, performance falls into these categories:
- 🔴 10% – Poor Performance: Needs strong support, training, and guidance.
- 🟠 15% – Below Expectations: Falling short of goals and requiring closer attention.
- 🟡 50% – Meets Expectations: Doing what’s required, but growth remains average.
- 🟢 15% – Above Expectations: Consistently delivering more than expected.
- 💎 10% – Excellent Performance: Driving innovation, results, and continuous improvement.
Why Team Leaders Should Care
The reality is simple: if half the team only meets expectations, overall growth will remain average.
True progress happens when more people move into the Above Expectations and Excellent zones.
But here’s the catch 👉 this doesn’t happen through yearly reviews alone.
It happens when leaders coach, mentor, and guide team members every single day.
Key Takeaway for Leaders
- Don’t just measure performance — develop it.
- Use the bell curve as a tool, not a label.
- Focus on upskilling, feedback, and motivation to shift people upward.
Discussion: The Big Question for Leaders
👉 What’s your view?
Does the performance bell curve truly push people to perform better?
Or does it limit growth by boxing employees into fixed categories?
🚀 Join Our Premium Job Group Today! 🚀
✅ Get access to 100+ daily job & internship updates from top OEMs & MNCs
✅ Includes HR emails, contact numbers, job details, Google forms & placement drive updates
✅ Jobs & Internships across multiple roles & departments
✅ Stay ahead of the crowd with exclusive opportunities shared only in our Premium Group
🔥 Don’t miss out—your next career move starts here!
👉 Join Now: https://topmate.io/ajay_kumar79/1422124
